


What
You’ll Learn
You’ll Learn
- Microsoft Excel
- Reporting
- Controlling
- Dashboards
- Business Charts
- Management Information System
- Business Analytics
- Data Analysis
Requirements
- Basics in MS Excel
Description
GENERAL
When controllers create reports or tools, they are not always read by management.
Too often, the reports contain superfluous material, such as clipart, or confusing graphics and numerous legends.
In this Online-Course you will learn how to create professional Business Charts with Excel step by step.
The concept named OPO – one page only.
At PUMA AG I was responsible for the worldwide Retail Controlling and developed a new Reporting-System for the stores. All reports were standard at board-management.
In Germany I publish many articles and books about Microsoft Excel and how to use professional Dashboards in companies.
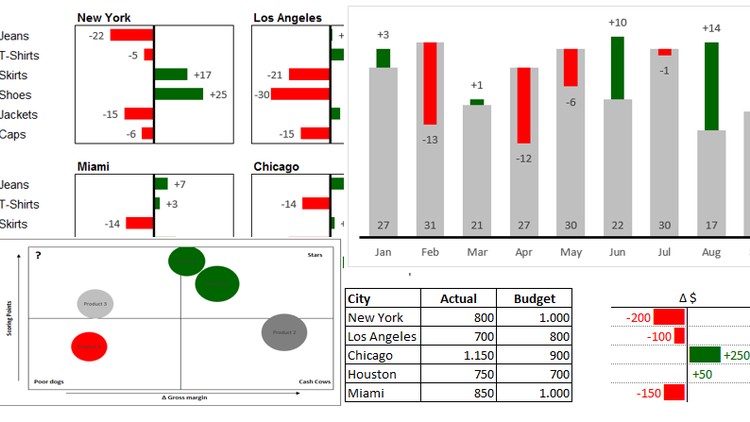
CONTENTS (with Excel 2013 – 2016) you will learn:
-
Building a professional table
-
Deviations (Euro and percents) in tables
-
bar charts
-
Portfolio / 4 fields matrix
-
Charts for developments
-
Using the Excel camera
In addition, you will receive the Excel training file (including the formulas and solutions)
COURSE OBJECTIVE
After the video course, you will understand the key techniques and methods for successful reporting and you will know how to create professional dashboards in Microsoft Excel.
Basic knowledge of MS Office and an Excel version on your own computer
required.
PLEASE NOTE
The video course was created with Excel 2016, but the charts and tools can also be used with Excel 2010 and 2007. The approach is very similar.
Who this course is for:
- Financial Analyst
- Merchandise Planner
- Controller
- Accounting Manager
- CFO
- Sales Assistant
- Management Consultant
